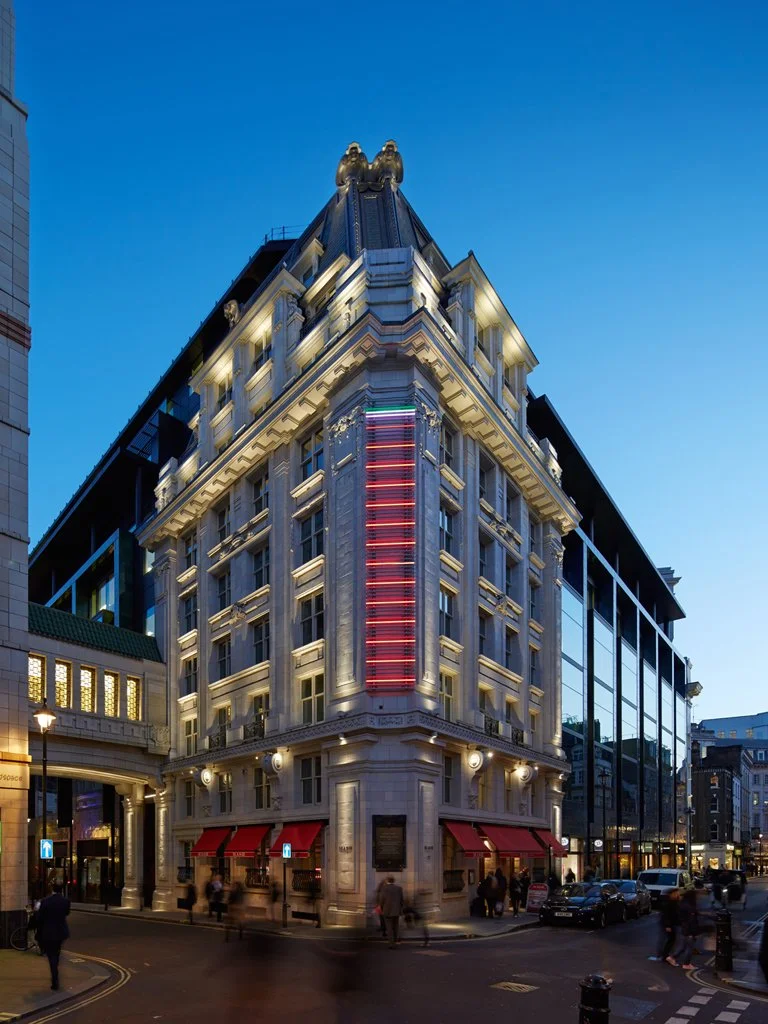

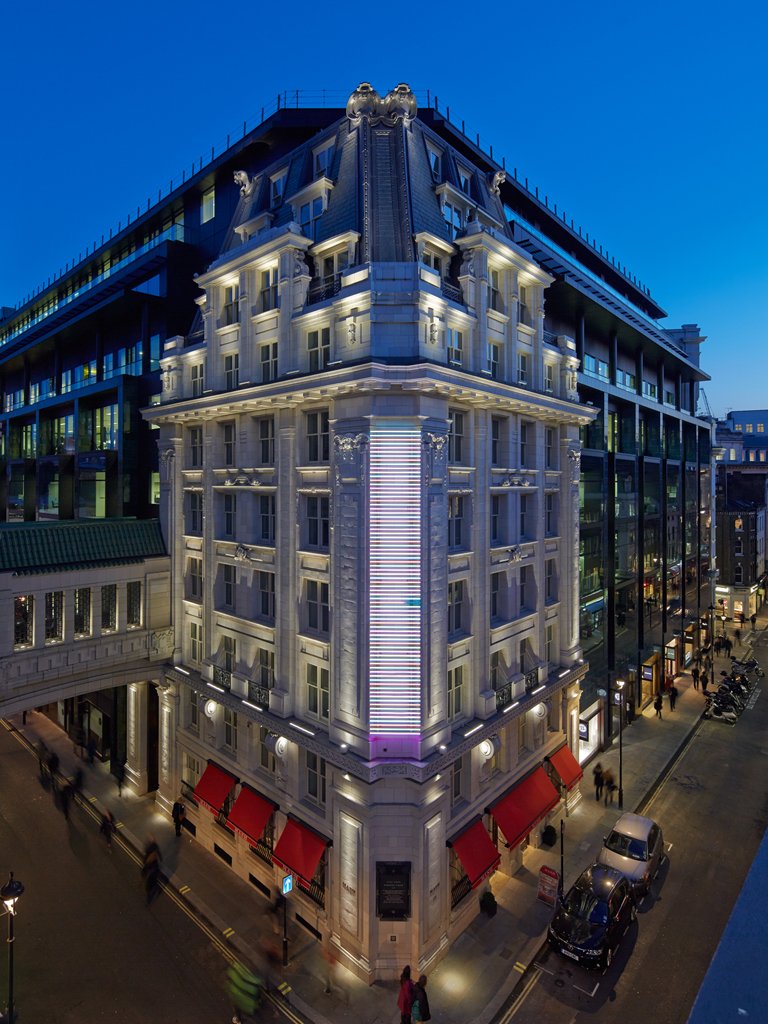
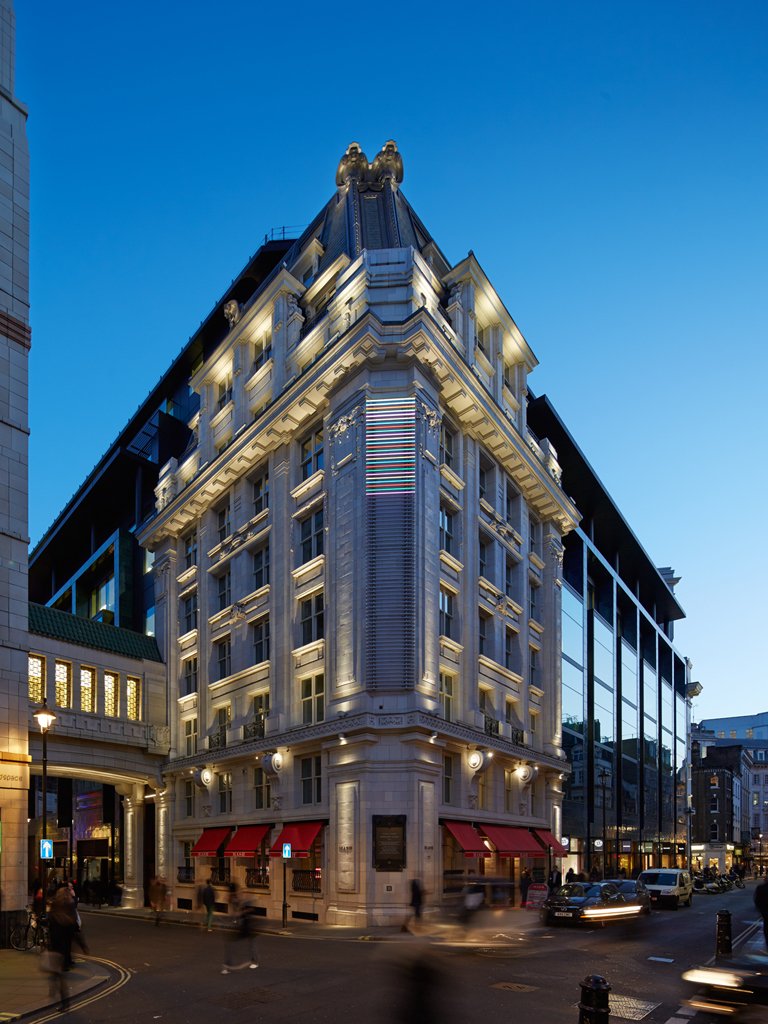
Vital Signs
Installation at the Quadrant, London
LED light bars, custom software
2012
This light sculpture makes the inner life and systems of the building visible by translating data streams into the abstract form of a neon-type zipper bar graph. Yellow light describes the total power consumption. Green light describes the fuel cell production. Blue light describes recycled rainwater usage. Red light describes the ambient temperature inside the building, and violet light describes the activity of the elevators.